| Information - 2001 Census |
|
Many of you will recall completing the census form in 2001, well now the Office of National Statistics Website has published detailed results based on local council wards. In the council wards referred to below,"Hartley" is in fact Hartley, Hodsoll Street and Ridley, "Longfield" is Longfield, New Barn and Southfleet, and "Ash" is Ash and New Ash Green. Numbers The total populations are:
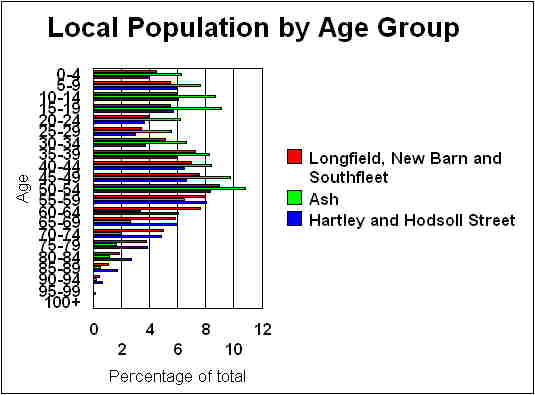
The distribution of population chart below makes interesting reading. While Hartley and Longfield have a similar age profile, the younger population of New Ash Green is vividly shown. Ash leads the other two wards right up to the 50-54 age group and then falls well behind its neighbours. Hartley has significantly greater numbers of people over the age of 80.
Movement of People It is said that people move on average every 6 years. If this is the case, then the population of our corner of Kent is much more settled, less than 8% of people have moved home in Hartley in the year before 2001. Incidently the census proves one local addage - that people move around in New Ash Green rather than away, for Ash ward has a far higher number of people moving within the ward in the previous year than Hartley and Longfield!
Qualifications Overall people in our area have on average more qualifications than Kent as a whole. Ash is the highest qualified ward of the three.
Work The three wards display similar figures, except a wide difference in the number of students and retired, which reflects the age profile above. In addition a slightly higher percentage of employers live in Hartley and Longfield.
The census then goes on to break down employment figures into a number of business sectors. The contrast with the census of a century ago is striking. Then most were employed in agriculture, now only 1-2% make their living from the land. No doubt influenced by developments like Bluewater, retailing is the main employer across all three wards, with manufacturing and general business being big employers too. The public sector is a big employer too, particularly in Education and Health.
About 25% of those in employment work part time (up to 30 hours per week). Many local people work long hours, 529 Hartley residents (28% of those in full time work) said they worked for more than 48 hours a week during the 4 weeks before the census. Hartley people travel furthest to work on average - 12 miles. And driving your own car to work is by far the biggest means of transport to work, apparently without any passengers. Ash appears to be the greenest ward with the highest numbers travelling by foot or on bicycle. And over the three wards 1,000 people do not have to commute to work at all!
Car Ownership While we are on the subject of transport, the number of households without a car is highest in Hartley, but conversely the village has a greater proportion of households with more than 3 cars too:
In all there were 3,671 cars or vans in Hartley and Hodsoll Street in 2001. Social Class Using the A-E social classes, so beloved by advertisers, we find that Ash turns out to be the most middle class of the three wards (ie. those with most ABC1s) with 65.6%, although Hartley has most of the AB social class. Hartley is by a small margin the most working class (ie those with most C2DEs) at 36.8%.
Housing There are very few empty properties in Hartley and Ash (1%), but for some reason Longfield almost 3% standing empty in 2001. The ownership statistics throw up some interesting comparisons. While the owner-occupied figure is similar for all three wards, far more are owned outright (ie without mortgage or shared ownership) in Hartley and Longfield - no doubt a reflection of Ash's younger population, while the number of council houses is far higher in Longfield because Sevenoaks has transferred most of its houses in Hartley and Ash to a Housing Association.
Health Ash (76%) has more people who said they were in good health on census day than Longfield and Hartley (both 71%) - perhaps a reflection of the relative age profile of each community. 958 people (16%) in Hartley said they had a long term limiting illness, compared with 15% in Longfield and 11% in Ash. The census also highlights the large number of people who provide unpaid care. 612 people (10.5%) in Hartley are carers, 74 of whom for over 50 hours per week. In Longfield 11.6% of people are carers, while in Ash the figure is 8.1% Religion The census results show our three wards are overwhelmingly Christian, those with no religion at all being a distant second. Those of you who subscribed to the internet campaign to put "Jedi Knight" for this question were put in the "no answer" category, I think. The largest religions in the other category for our area are Hindu and Sikh. Longfield is clearly the most religious ward of the three.
Source: Office for National Statistics. (Crown copyright material is reproduced with the permission of the Controller of HMSO and the Queen's Printer for Scotland.) |