
Census 1991 - 2011
Info > Information Pages C-F
Introduction
The 1991 Census was held on 21/22 April 1991. The UK Data Service has copies of the forms to be filled in. This census was the first to ask about the ethnicity of each person, as opposed to earlier censuses which just asked for place of birth which is not the same thing.
The lowest level data is for the council wards of Ash-cum-Ridley, Fawkham and Hartley and Longfield. Although the names of the wards had not changed there had been a number of significant boundary changes, which make direct comparisons with earlier censuses an inexact science:
- In New Ash Green the estates of Bazes Shaw, Farm Holt, Penenden and Caling Croft were transferred from Hartley to Ash.
- The boundary between Hartley and Longfield was adjusted to the railway. This meant Hartley gained properties in Hartley Bottom Road and the future Bramblefield. Initially Hartley gained the properties in Fawkham Road to the south of the railway bridge, but they were later transferred to Fawkham.
- Longfield gained most of New Barn which had previously been in Southfleet parish. At the same time the whole parish was transferred from Sevenoaks to Dartford borough.
A selection of the data available on the Nomis website is set out below. Details are contained in the 1991 Census Summary Sheet.
Copyright acknowledgement: Contains ONS data. Contains public sector information licensed under the Open Government Licence v3.0.
People
For more details see 1991 Census Summary Sheet.
Population
After two decades of rapid rises, the area only saw a small increase between 1981 and 1991, after the addition of New Barn is taken into account.
- Ash-cum-Ridley 7,576 (1981 - 5,570)
- Fawkham and Hartley 6,168 (1981 - 7,457)
- Longfield 4,907 (1981 - 2,241)
- Total 18,651 (1981 - 15,268)
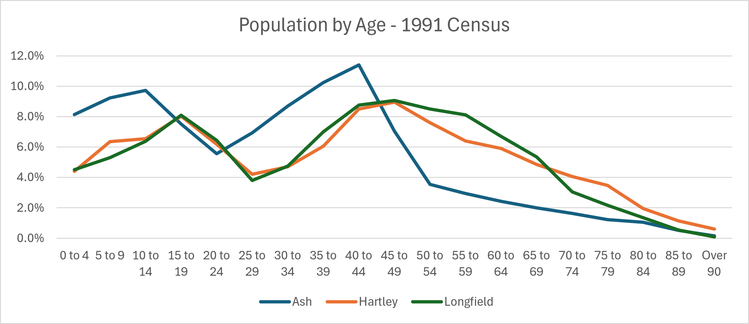
Age
The age profile shows a generally aging population, it is noticeable that some of the peaks in the 1981 census are replicated but for the age group 10 years older in 1991.
Sex
Females made up 50.5% of the population locally and males 49.5%. The age group with most males was 15-19 with 53.5%, the age group with most females was the over 90s with 90.4%.
Marital Status
The number of married people at 65% had significantly fallen from the 1981 census (75%). There are signs that people were delaying marriage. In 1981, 87% of the 25-29 age group were married, but this had fallen to 54% in 1991.
Ethnicity
This was the first census to ask for the ethnicity of the respondents in a rather more general way than today. For example there was a single category white for all from UK/Ireland/Europe/Old Commonwealth etc, they made up 98.2% of the population in our area, with the numbers for each parish not that different. The next highest group was south Asian (Indian/Pakistani/Bangladeshi) who made up 0.7% of the population. Non-whites tended to be younger; of the 2,539 people over 65 in the three wards only 5 (0.2%) were non white.
The 1991 census continued to ask for country of birth, and England had increased from 92% in 1981 to 93.4% in 1991. A comparison with the New Commonwealth numbers and ethnicity shows the problems of relying on country of birth to infer ethnicity, which is presumably why the questions were changed. It seems our area had more people born in the New Commonwealth than said they were black or Asian. It is possible our area must have had a number of people born to service personnel or colonial administrators before independence.
Health
Overall 7% of people said they had a long term illness, half of them were over 65. The numbers were lower in Ash because its population was younger than Hartley and Longfield.
Housing
For more details of the themes mentioned below, see 1991 Census Summary Sheet.
Tenure
The 1991 census shows the effects of the Right to Buy policy introduced in 1980. In 1981 Hartley and Longfield had the highest levels of social housing, but their share had halved by 1991 with concomitant increases in owner occupation. At 89% owner occupation had reached its peak locally. In the social rent section, the transfer of Sevenoaks Council's housing stock to West Kent Housing Association in 1989 is shown in the lower levels of council housing compared with Longfield.
Housing Stock
There are quite a difference between Hartley and Longfield, where more than half the houses are detached, and Ash, where 63% of the houses were terraced, the main type of housing in New Ash Green.
Sub-standard housing lacking baths or inside WCs had been practically eliminated. In our area, just one house (at Longfield) still only had an outside WC. The 1991 census added a new measure of deprivation in lack of central heating, 3% of houses locally did not have central heating.
Size
The boundary changes mentioned above have impacted this greatly. Longfield has gone from having the smallest houses in 1981 to the largest in 1991. We may infer therefore that New Barn, which had been added to Longfield in the meantime, is the home of executive house! This also had the effect of pushing up the average number of rooms from 5.4 to 5.7 for the whole area. Hartley saw an increase in house size too, but this was no doubt down to the smaller housing in New Ash Green being transferred to Ash parish.
Migration
As usual the census asked if they had moved within the last year and if so from where. The numbers of people moving here had fallen a lot from 11% of all households in 1981 to just 4.5% in 1991. New Ash Green saw the biggest turnover of people (6.7%) and also by far the biggest number of people who moved within the same village.
Work
The census conducted a 10% sample of the occupations people wrote on the forms. The big change from 1981 was the rapid decline of manufacturing jobs from 21% to 12%, a national trend at the time where the country's economic policies led to widespread closures and an increase in unemployment. Service employment increased from 41% to 46%, while agriculture continued its long term decline in employment from 3% to 1%. However in a separate question, the majority of those who were unemployed had previously worked in banking and finance.
There was not a great change in the distance travelled to work, so some guesswork is necessary to work out where these places are likely to be. The distances suggest that for Ash and Hartley, the most popular destination would have been the towns of Dartford and Gravesend. Central London was probably the next most popular work destination.
The census also did some research on women in the workforce. It found that a majority of women with partners in this area who also had children aged 0-15 were also in paid employment, with part time being by far the most popular by a margin of about 2 to 1.
Social Class
The traditional ABC classification was introduced in the 1950s. It has 6 categories based on the education and occupation of the head of the household. They are:
AB Managerial and professional
C1 Non manual (e.g. supervisors, clerks, junior managers)
C2 Skilled manual workers (e.g. plumbers, electricians)
D Semi-skilled manual workers (e.g.e machine operators)
E Unskilled workers
Traditionally ABC1 is considered middle class, C2DE working class.
The census does use the ABC social class categories but does use something similar although I can't be sure that a direct comparison with earlier censuses is possible. While the percentage of C2DE people was little changed from 1981, there were a lot more AB people (56%) at the expense of the C1s (15%).
Car Ownership
There are not many living standards questions in the census. One, on household amenities has been mentioned above. While the number of no car households was virtually unchanged at 11%, there were increases in the number of households owning multiple cars. The result was that the total number of cars in the 3 wards rose by a half from 6,464 in 1981 to 9,937 ten years later (however it must be remembered that this will be partly accounted for by the addition of New Barn).
While the no car households only made up 11% of the total, in nearly half of households there were more adults than cars.
2001 Census
Introduction
The census was held on 29 April 2001. The UK Data service has copies of the forms completed by every household.
The 2001 census offered more areas for the results. This included the Longfield/New Ash Green urban area which excluded the rural areas of the three wards, e.g. Longfield Hill and most of Fawkham, Hartley Bottom Road.
People
Population
While Nomis does not do reports at a parish level, the introduction of Output areas allows us to disaggregate the data for each parish. It reveals that a lack of developments in the 1990s had led to the population of Ash and Hartley falling while Longfield remained the same.
- Ash: 7,089 (1991 - 7,576)
- Hartley: 5,433 (1991 - n/a, grouped with Fawkham)
- Longfield: 4,908 (1991 - 4,907)
Density varied greatly from the rural areas of Ash, Hodsoll Street and South Hartley (1 person per ha) to Caxton Close (92 per ha).
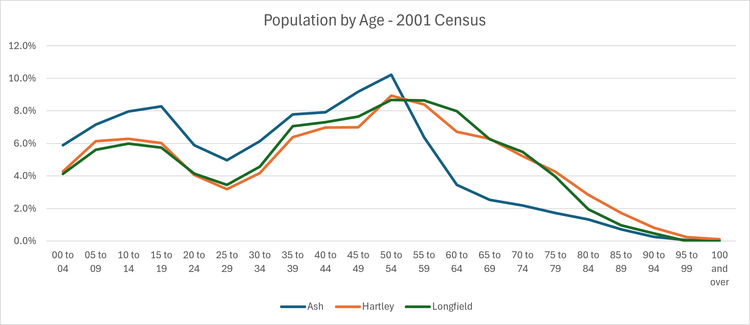
Age
As might be expected from a declining population, it was also an ageing one. The cohort of people who moved to New Ash Green in the 1960s and early 1970s was now in their 50s as shown by the peak in the chart and above that age the proportion of older age groups in Ash falls sharply. As ever Hartley and Longfield closely follow each other and have a noticeably older population than Ash.
Sex
Overall 51.5% of people were female and 48.5% male. Of the small areas Bramblefield (72.6%) had the greatest proportion of females, while Caling Croft (54.3%) had most men.
Marital Status
The proportion of those married fell from 65% in 1991 to 61% in 2001. Many of the New Barn small areas had the highest rates of marriage for adult population including Festival Avenue (77%), Fairlight Cross (76%) and Shearwater (75%). The lowest levels were all areas with a bigger number of elderly people.
This was the first census to ask about same sex couples. The results are only available at a district level. In Dartford 0.2% and in Sevenoaks 0.1% of people over 16 were living as a same sex couple.
Ethnicity
97% of the people in the three parishes were white, and 98% of them were in the white British category. Asian, Mixed and Chinese/Other categories had 1% each. Across the three parishes the place of birth was fairly consistent with 93% born in England and another 3% in the rest of UK and Ireland. Europe was the most popular for those born further afield.
Health
Nomis has data for the general health of adults between 16 and 74, although it must be remembered that is a subjective question that was left up to the respondent to decide. The result was uniform, every one of the three parishes had 94% of people saying they had good or fairly good health, with the remaining 6% having poor health.
Religion
This census was the first to ask for people's religion, although the question was not mandatory. There was an internet campaign at the time to put "Jedi Knight", such replies were either added to the no religion or no reply categories. Overall 79% said they were Christian, 14% Atheiest, 6% gave no answer and all other religions combined made up 2% of the population. The highest number of Christians were in the small areas of Gorse Way, Carmelite Way, Turnstone and Longfield Hill, all 88%. Atheism was strongest in Capelands and Manor Forestal West small areas, both at 23%.
Housing
With very little change in the number of households (up 1% to 6,710), it is not surprising that the results for Tenure, Type of house and Household size were little changed too.
The big change was the availability of the data for the smaller output areas. It shows that owner occupation was highest in New Barn at all but 100%. In only two areas was owner occupation in a minority - the Wellfield estate in Hartley and Turners Oak area in New Ash Green.
Household size
Overall 36% of people live in 2 person households, followed by 1 person (21%), 4 people (18%) and 3 people (17%).
This measures shows a massive range for the smaller areas. At the one end Bramblefield (100%) and Turners Oak (97%) areas were nearly all 1 or 2 person households. On the other hand Caxton Close and Porchester Close had 20% of households of 5 more more people, when houses there are no more than 3 bedroom in size. Places with large houses such as Redhill Wood and New Barn tend not to have 1 person households.
Migration
As before, people were asked to say where they had been living a year before census day. Overall 8% of people had moved to our area in the previous year. The census data also recorded the number of people who had moved out of this area. Over the 53 small output areas there was a net loss of 71 people by migration. One area to buck the trend was Main Road, Longfield around the schools where migration was a net +26, the difference being that Hazlewood Nursing Home opened in 2000, so many of the new residents would have moved in the year previous to the census.
Work
Economic Activity
Two thirds of the local population between the ages of 16 and 74 are in employment or self employed. Ash has 73% in employment, Hartley with its older age profile, only 61% with a much higher proportion of retirees. Unemployment was very low at 2% for the area. In the smaller output areas, those with more older people or poorer people tended to have higher levels of unemployment, caring responsibilities or disabilities.
Place of Work
The 2001 census marked a big advance in this metric. Previous censuses had only been based on a sample and were not clear where people commuted to. In 2001 the results are given down to ward level both for origin and destination.
The most popular workplace was Dartford (excluding Longfield and Southfleet). Taken with the other North Kent Thameside boroughs of Gravesend and Bexley, they made up 29% of the local workforce. Next were people who worked in our area itself, either at home or within the 3 wards, who made up 28% of the workforce. The rest of South London was the destination for 10%, followed by Sevenoaks and Tonbridge with 9%. Only 3% of locals worked in the three docklands boroughs.
Three quarters of people commuted to work by car, either as driver (70%) or passenger (5%). Next most popular was rail at 11%. The commuter coach was a very real competitor to the railways. 241 travelled from the three wards to central London or Docklands by coach and 575 by train, showing it had taken about 30% of the business of the railway. Although it took longer, it was cheaper and had the convenience of going more or less door to door to places like New Ash Green and New Barn.
Living Standards
Cars
One indicator of living standards in the Census is car ownership. The 2001 census saw the trend of greater car ownership continuing. In 1991 there were 48% of households with more than 1 car, this had risen to 52% in 2001. The number of no car households remained static at 11%. Basically the proportion of no car households has been unchanged in all the censuses since 1981 to 2021.
The Nomis reports have changed the way numbers in the household and car ownership is recorded. Overall 31% of households definitely had fewer cars than adults, a big fall on the 49% in 1991, but it is likely that not every such household is counted.
Small areas with the greatest number of cars included Fairlight Cross (75%), South Hartley (75%) and Capelands (72%). Areas with most no car households tend to be those with more older people - Turner's Oak (60%), Bramblefield (55%) and Wellfield (30%). Areas with a higher proportion of social housing also tend to have more no car households.
Social Grade
The oldest measure is the ABCDE one originally used for newspaper readership. People with grades ABC1 are traditionally considered middle class, those who are C2DE working class. 65% of adults were ABC1, with Lambardes being the highest small area with 83% ABC1, followed by Coltstead area with 79%. Because those who retired on just the state pension are classed as E, this means that the small areas with the largest number of the elderly tend to have the most C2DE social grade people. This is led by Turners Oak (56%), Bramblefield (46%) and Main Road (part including Hazlewood - 39%).
Census 2011
Introduction
The census was held on 27 March 2011. It was notable for being the first one where respondents had the option of filling in the form online. A copy of the Census Form is available on the UK Data Service website.
Since the 2001 census a local government boundary review had altered the ward boundaries in both Dartford and Sevenoaks districts. The Longfield ward had become part of an expanded Longfield, New Barn and Southfleet ward, while to equalise the size of the wards Hodsoll Street parish ward of Ash ward was added to Hartley instead of Fawkham which was joined to West Kingsdown. However the 2001 census results already took account of these changes.
People
In spite of another 150 households being added since 2001 (to make the total 6,862), the population of our area continued to decline as it aged. Longfield had a small population gain, but there was a very large fall of 448 people in Ash.
- Ash (2011 - 6,641, down 448)
- Hartley (2011 - 5,359, down 74)
- Longfield (2011 - 4,909, up 11)
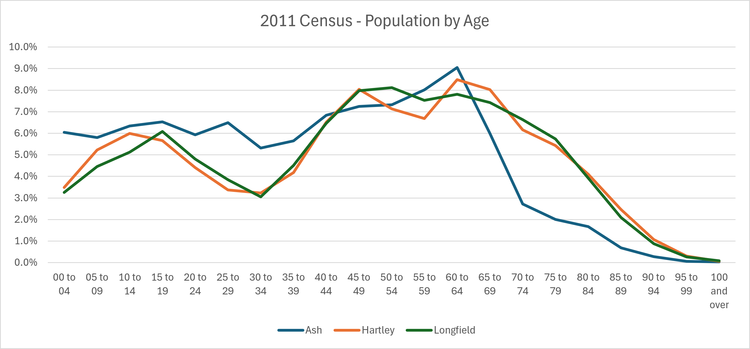
Age
With little new development going and low numbers of people moving, the area continued to age, a trend that continued in 2021. As usual Hartley and Longfield have similar age profiles, but Ash (thanks to New Ash Green) is noticeably different.
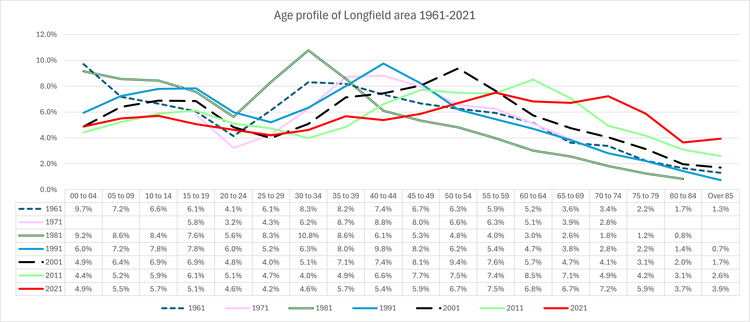
Over time the trend of an ageing population is apparent with 2011 setting a record for the proportion of people over the age of 55, only to be beaten again by the 2021 census. The effect of New Ash Green is apparent. The 1981 census has a spike for young adults which moves 10 years older in each successive census, in 2021 this is now reflected in the 70-74 age group.
Sex and Marital Status
As might be expected with an ageing population, the proportion of females rose by 0.3% to 51.8%. The number of those married in all three parishes continued to decline, but overall 58% of adults were married in 2011 (61% in 2001). Since the previous census, same sex couples were enabled to become Civil Partners, and 0.1% of adults locally had done so.
Ethnicity
This was little changed from the previous census. 96% said they were white, 2% south Asian, 1% mixed and 1% all other categories.
Overwhelmingly people were born in England (92%) with another 3% born in the rest of the UK and Ireland. English born people were highest (96%) in Caling Croft, Brambledown, Larksfield and Turnstone areas.
This census was the first to ask about national identity, that is whether people felt they were British, English or something else. Unfortunately the results are only available on Nomis at district level and not for smaller areas.
Religion
The numbers saying they were Christian had fallen since the previous census from 78% to 69%, the main beneficiary being atheism. In no small area was Christianity below 50% but it was 53% in Caxton Close and Porchester Close. At the other end of the scale, 80% of people in the Lapwings area of New Barn were Christian. Atheism was strongest at Ayelands North at 37%.
Health
In 2001 people were asked whether their health was "good" or "not good", in 2011 they were given 5 options. Allowing for this the results were fairly similar with most people saying they had good or very good health.
Housing
This is one area whether the 2011 census shows a very significant change, when it comes to housing tenure. Privately rented properties had more than doubled since the 2001 census from 4% to 9% of all households, mostly at the expense of owner occupation.
When the smaller output areas are looked at, it is clear that the private rented increase was concentrated in the places with cheaper housing, in particular those areas of New Ash Green with a higher proportion of 1 and 2 bedroom houses e.g. Private rent now made up 25% of the houses in Farm Holt, 20% in Caling Croft and 18% in Chapelwood, Ayelands and Seven Acres, while the numbers were much lower in the parts of New Ash Green where the housing is mostly 3 or 4 bedroom. It really does appear that first time buyers were being out competed for starter homes by the buy to let landlords.
As might be expected, with little development in the preceding 10 years, the profile of the local housing stock had not really changed much (42% detached, 22% semi-detached, 28% terraced, 7% flat).
Migration
Levels of migration were similar to 2001. About 8% of people had moved here in the previous year with a quarter having only moved within the council ward. As usual the numbers moving within the ward were much higher in New Ash Green than elsewhere.
Work
Industry employed in
The largest number (26%) were employed in the public sector, which encompasses Health, Education and Administration. The next highest (19%) was retail, catering, hotels etc and then Construction (12%).
Method of Travel to Work
People's method of transport to work had little changed. It is dominated by car, 65% travelled to work as a car driver and another 4% as a car passenger.
Workplace Location
Likewise the destination for workers had not changed much since 2001. Most popular was Dartford Borough excluding Longfield and Southfleet (17%), Central London (11%), Sevenoaks District (excluding Hartley and Ash) and Gravesham (both 9%) and Bexley and Inner South London at 7% each.
Living Standards
The 2011 census had dropped the questions about hot water and baths, which were already at just about 100% locally. However some living standards questions remained in the questions on car ownership and central heating.
For more details see:
Car ownership
This had not changed much since 2001, however the number of no car households had fallen further from 11% to 9%. In 2011 there were 11,496 cars in our area, very nearly double the number in 1981. This could well be an indicator of improved living standards over the preceding 30 years.
Central heating
Only 1% of households did not have central heating at all. Gas central heating (81% of households) was by far the most popular, followed by Electric (9%) and Oil (4%). The predominance of gas was only limited by the range of the gas main. This meant that oil heating was the leading means in Ash, Hodsoll Street and the rural parts of Hartley. Bramblefield and Bazes Shaw were respectively 95% and 77% electricity.
Social Grade
64% of people aged 16-74 were middle class using the traditional grades ABC1, 36% were working class (grades C2DE) which was little changed from 2001. Needless to say there was a wide range between the small output areas. Billings Hill Shaw with 52% ABs appears to be the home of the executive locally. Although using grades based on economic indicators such as job has been questioned. It is said people are less likely to vote based on economic grounds now.