
Electricity and Gas
Info > Information Pages C-F
Electricity
Mains electricity arrived in Longfield on 4 September 1931 and Hartley on 18 August 1932 when the Fairby Lane substation went online. Ash, Hodsoll Street and Fawkham had to wait until 1936. Hartley Bottom did not get electricity until 1942 when wires were brought from Church Road to the Websters Whiting Works.
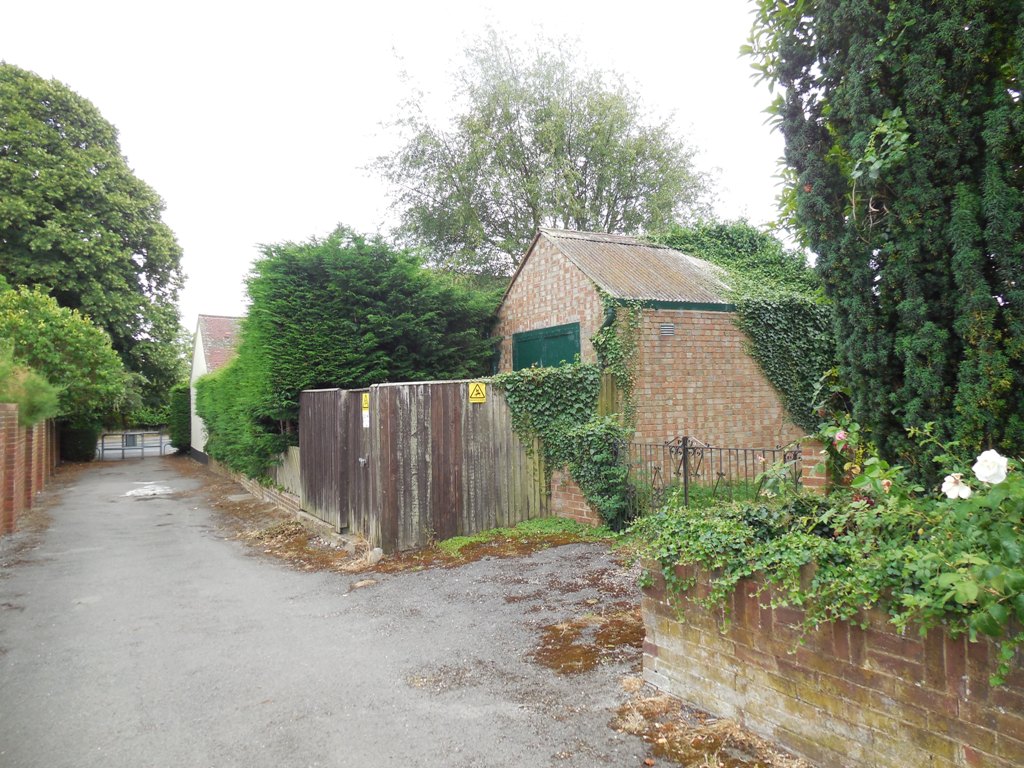
Electricity Substation at Fairby Lane, built 1932
In 2016 the UK generated 340 terawatt hours or electricity and imported 17.5 TWh mostly from France and the Netherlands interconnectors. 108 TWh was used by domestic customers, the rest by industry and the service sector. The fuel used in UK generation was gas (42%), Renewable (24.5%), Nuclear (21%), Coal (9%), other (3.1%). Within the UK there is a net flow of generated electricity from the north and midlands to the south, which lacks generating capacity.
Nearby power generators (with installed capacity) are:
- Grain, opened 2010 (Uniper UK Limited - Combined Cycle Gas Turbine - 1,404 MW)
- Grain, opened 1978 (Uniper UK Limited - Gas Oil - 56 MW)
- Medway, opened 1995 (Scottish & Southern - Combined Cycle Gas Turbine - 700 MW)
To reduce losses in transmission, transformers are used to step up the generated power to around 400,000 volts for the main overhead lines. It is then successively stepped down by a series of transformers and substations, ending with the small stations in most streets, that step the current down to the 240 volts we use in the home.
Electricity is sold by a myriad of suppliers with different plans and tariffs. Nationally the average price paid by domestic users in 2016 was 14.03p per kilowatt hour. Domestic users pay more for their electricity than other customers.
Gas
Mains gas arrived in Hartley about 1961, but the coverage of Hartley by mains gas is still somewhat patchy outside the central area. The Bramblefield Estate near Longfield Station is all electric, and it has still not reached the southern end of Church Road and Hartley Bottom, where many households rely on Calorgas or oil central heating. See table below for roads not on the mains.
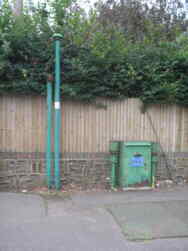
Gas Governor Site just off Ash Road
Gas accouts for about 65% of a typical household's energy consumption, with electricity 23% and petroleum 6% making up most of the rest. In 2015 UK domestic customers bought 307 GWh of natural gas. The UK became a net importer of gas in 2004 and the gap between production and imports has continued to grow. Imports are mainly from Norway, Qatar (liquified petroleum gas), the Netherlands and Belgium.
Gas is sold by a myriad of suppliers with different plans and tariffs. Nationally the average price paid by domestic users in 2016 was 4.16p per kilowatt hour. Domestic users pay more for their gas than other customers.
Green Energy
When it comes to green energy, Hartley has a long way to go. A scan of satellite photographs suggests there are only 29 solar panel installations in the whole parish, although this is an inexact science. Fairby Lane and Chantry Avenue appear to be the greenest roads in this regard. A typical 4KW installation will generate 3,400 kWh of electricity a year, so they would provide about 15-20% of the energy needs of a Hartley household. It seems amazing to me that in this day and age it is not a requirement for all new homes to have solar panels installed.
Hartley has no wind turbines.
In 2009 Sevenoaks Council received 33 applications to install cavity wall insulation in Hartley with a further 38 in 2010. They are not recorded on the building regulations database after that.
Energy Statistics
The government have produced experimental statistics on energy consumption by postcode. The idea is apparently to enable local authorities to target energy efficiency schemes at those areas which need it most. As usual postcodes with too few properties are excluded to prevent individual house consumption being identified.
Looking at the statistics for Hartley, the roads with no gas are shown as "n/a". Some meters could not be allocated to postcodes, so the figures represent a 90% sample. What they can't take account of are households which use calor gas or oil in non-natural gas areas. In general the rule of thumb is that the bigger the houses the greater energy consumption, but affordability may also be a factor too.
The roads with the highest average total gas and electricity consumption are:
1. Hottsfield (31,009 KWh per year)
2. Manor Drive (30,299 KWh)
3. Downs Valley (29,877 KWh)
4. Banckside (29,736 KWh)
5. Round Ash Way (29,733 KWh)
And the lowest are:
1. Bramblefield Estate (7,653 KWh per year)
2. Silverdale (8,622 KWh)
3. Hawthorns (12,643 KWh)
4. Pitfield (13,035 KWh)
5. Porchester Close (13,837 KWh)
Information supplied by the Department for Business, Energy and Industrial Strategy. Published under Open Government Licence.
| Road | Gas (KWH/Year) | Electricity (KWH/Year) | Solar Panels (est) |
| Ash Road | 22,928 | 5,766 | 2 |
| Banckside | 25,075 | 4,661 | 1 |
| Bedford Square | n/a | 7,318 | 0 |
| Beechlands Close | 14,259 | 4,379 | 0 |
| Berrylands | 16,701 | 4,512 | 0 |
| Billings Hill Shaw | 16,872 | 4,075 | 2 |
| Brambledown | 11,085 | 4,076 | 0 |
| Bramblefield Close | n/a | 7,487 | 0 |
| Briars Way | 22,512 | 5,477 | 2 |
| Broomfields | 16,528 | 3,315 | 0 |
| Carmelite Way | 19,160 | 3,966 | 0 |
| Castle Hill | 19,595 | 5,561 | 0 |
| Cavendish Square | n/a | 7,551 | 0 |
| Caxton Close | 10,425 | 4,031 | 1 |
| Chantry Avenue | 18,832 | 4,731 | 3 |
| Chapelwood Road | too small area | too small area | 0 |
| Cherry Trees | 19,125 | 6,021 | 1 |
| Cheyne Walk | n/a | 8,000 | 0 |
| Church Road (to Manor Drive) | 21,586 | 5,183 | 2 |
| Church Road (Manor Drive - NAG) | n/a | 7,497 | 0 |
| Conifer Avenue | 22,061 | 5,139 | 0 |
| Copse Side | 17,994 | 4,346 | 0 |
| Culcroft | 11,291 | 3,769 | 0 |
| Culvey Close | 21,546 | 7,150 | 0 |
| Dickens Close | 19,659 | 4,568 | 0 |
| Downs Valley | 24,139 | 5,738 | 0 |
| Eaton Square | n/a | 8,384 | 0 |
| Everglade Close | too small area | too small area | 0 |
| Fairacre Place | too small area | too small area | 0 |
| Fairby Lane | 20,952 | 4,989 | 4 |
| Fortuna Close | too small area | too small area | 0 |
| Gorse Way | 19,765 | 5,081 | 1 |
| Gorsewood Road | 23,266 | 6,091 | 0 |
| Grange Lane | too small area | too small area | 0 |
| Grange Way | 22,907 | 6,041 | 0 |
| Green Way | 15,458 | 4,629 | 0 |
| Gresham Avenue | 18,107 | 5,578 | 0 |
| Grosvenor Square | too small area | too small area | 0 |
| Hartley Bottom Road | n/a | too small area | 1 |
| Hartley Hill | n/a | too small area | 0 |
| Hawthorns | 9,636 | 2,827 | 0 |
| Hoselands View | 15,436 | 5,013 | 0 |
| Hottsfield | 25,165 | 5,844 | 0 |
| John's Close | 20,706 | 4,993 | 0 |
| Larksfield | 15,159 | 3,746 | 3 |
| Manor Drive | 22,973 | 7,326 | 1 |
| Manor Lane | too small area | too small area | 0 |
| Manor Road | too small area | too small area | 0 |
| Manor View | too small area | too small area | 0 |
| Merryfields | too small area | too small area | 0 |
| Merton Avenue | 15,672 | 4,918 | 0 |
| Northfield | 11,498 | 4,315 | 1 |
| Oast Way | 19,191 | 3,619 | 0 |
| Old Downs | 21,576 | 4,653 | 0 |
| Parkfield | too small area | too small area | 0 |
| Perran Close | 17,008 | 3,829 | 0 |
| Pitfield | 9,612 | 3,423 | 2 |
| Porchester Close | 9,105 | 4,732 | 0 |
| Portland Square | n/a | 6,440 | 0 |
| Quakers Close | 16,598 | 4,302 | 2 |
| Round Ash Way | 24,788 | 4,945 | 0 |
| Russell Square | n/a | 8,294 | 0 |
| Silverdale | 6,619 | 2,003 | 0 |
| Simmonds Drive | too small area | too small area | 0 |
| Sloane Square | n/a | too small area | 0 |
| Springcroft | 17,063 | 4,664 | 0 |
| St George's Square | n/a | 8,343 | 0 |
| St James's Square | n/a | 6,437 | 0 |
| St Johns Lane | 20,581 | 4,295 | 0 |
| Stack Lane | 21,803 | 5,492 | 2 |
| Tates Orchard | 15,099 | 4,045 | 0 |
| The Crescent | n/a | 8,794 | 0 |
| The Mews | n/a | 7,797 | 0 |
| The Warrens | 19,832 | 3,624 | 0 |
| Viewpoint Court | 4,339 | too small area | 0 |
| Wellfield | 13,059 | 3,536 | 2 |
| Wickhams Way | too small area | too small area | 0 |
| Woodland Avenue | 19,153 | 4,176 | 1 |
History of Electricity Locally
While Dartford Urban District Council had built a power station in Priory Road for the town in 1901, it was not for many years yet before mains electricity would reach the wilds of Hartley. That is not to say that everyone did not have electricity, those who could afford it would have their own dynamo electric plant. The first houses in Hartley to get this were Hartley Manor ("wired for electricity" by 1901) and Old Downs. In 1910 Old Downs was said to have electric light and hot water radiators throughout the house, powered by an 11 HP electric lighting plant, dynamo and battery. The editor of the parish magazine, John Wells-Thatcher, put his "lion engine, dynamo, switchboard and 14 full size Hart accumulators" up for sale in June 1932 - clearly mains electricity is much more convenient! Many more even if they didn't have electric light, would require a battery for their wireless set.
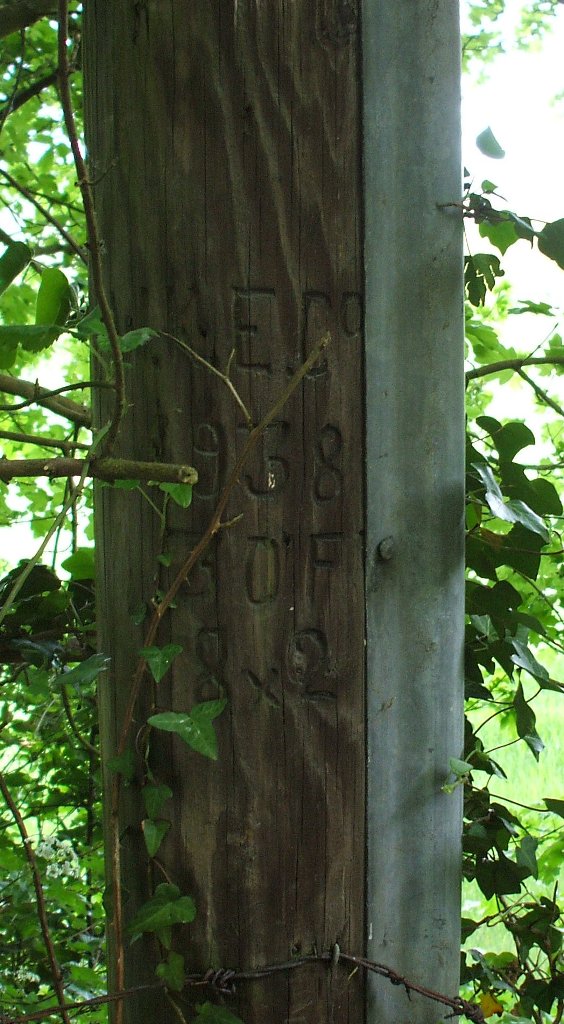
Electricity comes to Grange Lane in 1938 from the date on this pole
The first attempt to bring electricity to Hartley came in 1925 when the Gravesend Municipal Electric Company sought powers to extend its area to include Hartley and Longfield, and Fawkham, but not Ash [London Gazette 2 June 1925]. Hartley, Longfield and elsewhere were part of the areas allocated to the West Kent Electric Company by the West Kent Electric Power Act 1909, who objected to the proposed extension on those grounds. A public enquiry was held at Gravesend Town Hall on 23 April 1926. It appeared by then that Gravesend and Dartford councils had come to an agreement to allow Stone parish to be supplied from Dartford, if they supported the Gravesend application for the rest of the country area. Counsel for Gravesend and Dartford councils said that the West Kent Electric Company Limited had done nothing to bring electricity to the area in the previous 20 years, and had only laid mains when threatened now. Gravesend offered customers more flexibility in the tariff they paid. However when questioned by counsel for Dartford Rural District Council as to how soon our area would receive electricity, the Town Clerk of Gravesend said up to 10 years. This led Dartford RDC to request that the order not be passed unless Gravesend could show something would be done in our area. The representative of West Kent Electric Co, said they now supply the Thameside cement works from Barking, and had laid mains and built substations in Cobham and Meopham. In all they had spent £½ million. He said Gravesend's claim that this had been done to thwart their application was "preposterous" and "suggested megalomania". The General Manager of the County of London Electric Company, who were the parent company of West Kent, said the claims of WKEC doing nothing to bring electricity here was based on old information, before his company took over, and that they were "actively pursuing a policy to give a supply, and were in a position to do so". [Gravesend Reporter 24 April 1926].
The objections of the West Kent Electric Company prevailed [Hansard 30 July 1930].
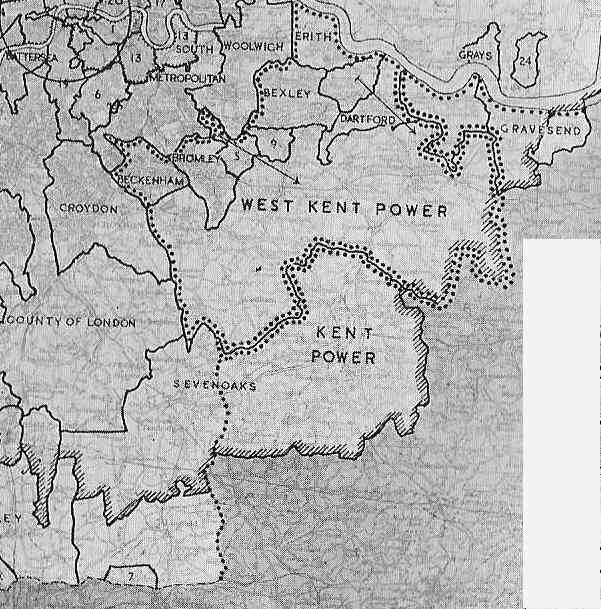
Map showing local electricity companies before 1948
The parish requested mains electricity in 1927 and it finally arrived on 18th August 1932, when the first substation near the junction of Ash Road and Fairby Lane was switched on. The Dartford Chronicle noted wistfully that "there was no ceremony to usher in the transition from the Middle Ages to modernity". The Chronicle also reported the arrival of electricity in Longfield on 4 September 1931. Ash, Hodsoll Street and Fawkham had to wait until 1936 to be wired up. South Ash a year later.
Originally the West Kent Electric Company had wanted to bring their cables overland from Pennis House in Fawkham, but couldn't get landowner permission, so it had to be brought by underground cable from Longfield. The company would connect up to 50 feet overground or 30 feet underground for free from the road to a house, but then charged 2/6 per yard overground and 9/- per yard underground (PRO POWE 12/371). Even then there were many parts of Hartley, who had to wait for many years more to get electricity, for example electricity had still not reached the south end of Church Road in 1936, however the date on one of the poles in Grange Lane is 1938. We can get some idea of the extent people had taken up mains electricity from the National Farm Survey in 1942. At that time the following farm holdings had electricity for light or light and power (mostly for domestic use):
Ash Road: Annlea, Woodlands, Avalon
Castle Hill: Culvey Down, Old Downs
Church Road: Cherry Orchard Farm, Middle Farm, Hartley Grange, Tor Lodge, New House Farm
Many farms did not have electricity then, most notably Hartley Bottom Farm. Cabling was extended from Church Road to the Websters Chemical Works in Hartley Bottom Road in 1942.
However the whole area then was underpowered, something which was to hamper the new pumping station in the 1940s. It also appears that the voltage was not increased to the 240 we know today until 1963.
The myriad of small electricity companies were replaced on 1 January 1948 when the Government set up the Central Electricity Generating Board and 12 area distribution boards, ours being SEEBOARD.
Electricity Charges
Never a popular subject, and almost as soon as electricity arrived, people in Hartley were asking for the price to be reduced (1938)!
Seeboard inherited a variety of charing regimes in 1948, but by the early 1950s the domestic tariff had been standardised at 1d per unit. This had risen to 1.1d in 1955, 1.2d (1957), 1.25d (1960), 1.5d (1962), 1.7d (1965).
In 1976 the charge was 2.525p per kilowatt hour for day units and 1.205p per KWh for night units.
In 2003 the day unit cost for Seeboard customers was 6.7 - 10.1p per unit, and 2.7p for night unit.
Further reading
Seeboard - the first 25 years (by Sydney Robinson, Seeboard 1974)
History of Gas Supply
Like electricity, Dartford had mains gas long before the villages. The Dartford Gas Company was founded in 1826, and was eventually merged with the South Suburban Gas Company in 1919.
Mains gas was not extended to Hartley until after the Second World War, although the parish meeting requested it in 1927 and the Dartford Chronicle of 7 April 1933 did say that the South Suburban Gas Company was thinking of laying on gas to the village. In the 1932-3 they presented a bill to Parliament, which was opposed by Dartford Rural District Council. The council petitioned parliament against the bill on a number of grounds. They were concerned that the power to charge people in the Hartley - Longfield area up to 2¾d above the basic 9½d per therm would hinder future development. It also objected to a later proposal in 1935-6 session of parliament because the gas holders proposed for Darenth, Eynsford and Sutton at Hone would be 120 feet high. It is unclear whether gas would have come to Hartley in the later bill. Mains gas did not arrive until sometime after the war. Certainly by 1961 town gas had reached Hartley. Conversion to North Sea Gas from town gas occurred in about 1975.
Since March 1997 households in Kent have been able to change their supplier. The Dartford Times of 9 January 1997 reported a complaint by a resident of Pitfield over the sales tactics of one of the new companies vying for business.
Charges for Gas
Gas charges are somewhat complex. Most people's meters record the number of cubic feet of gas supplied. However bills are calculated on the energy equivalent supplied, originally the therm, now the kilowatt hour. About 100 cubic feet of natural gas is equivalent to a therm, but as the bill below shows, town gas requires about 200 cubic feet to produce a therm of energy.
In 1950 the standing chrge per quarter was 1s 9d (9p) and gas 1s 5½d (7p) per therm. In 1976 South Eastern Gas had either a "Gold Star" tariff with a standing charge of £5.50 per quarter and a cost of 14.1p per therm (0.478p per KWh); or "General Credit" tariff with a lower standing charge of £1.25, but higher unit cost of 21.6p per therm (0.737p per KWh). A therm is a unit of heat roughly equivalent to burning 100 cubic feet of gas (the amount of heat generated by one cubic foot varies depending on the composition of the gas). Many people's meters still record gas in cubic feet supplied.
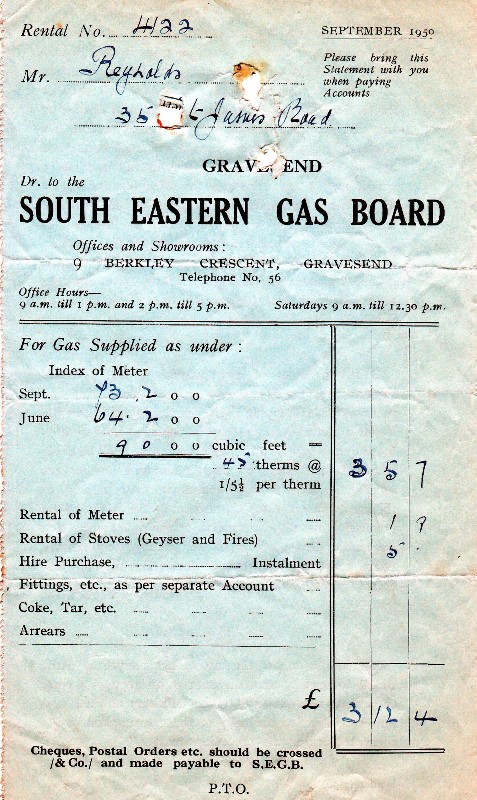
SEGAS bill 1950