Census 2021
Info > Information Pages C-F
Introduction
The data from the 2021 Census is now available on the Nomis website or the Census 2021 Interactive Map. There is a vast array of areas for which data is available, for example nations, regions, counties, wards and parishes.
Some data is available for the smaller "Output Areas", based on a collection of postcodes which cover just a few roads each. In Hartley, Longfield and New Ash Green there are a total of 54 Output areas, each covering an average of ``130 houses. The link below is to a spreadsheet with data for each output area.
You can find out which output area you live in by using the postcode lookup spreadsheet below, or the Census 2021 interactive map.
People
Population
The population of Longfield has risen significantly. Hartley has seen a small rise. New Ash Green a small fall, probably down to lack of new developments, clearly not the case in Longfield.
Population density for Hartley and Hodsoll Street is 451 persons per square kilometre, but this masks a massive range from 69 per sq km in Hodsoll Street and Ridley (with lots of farmland to factor in) to 8,374 per sq km in Caxton Close and Portchester Close (see Output Areas - Summary).
| Ward/Parish | Households 2021 | Population 2021 | Population 2011 | Change |
| Ash and New Ash Green ward & parish | 2,461 (-7) | 6,074 | 6,165 | -91 |
| Fawkham Parish | 558 | 578 | -20 | |
| Hartley and Hodsoll Street ward | 2,427 (+22) | 5,932 | 5,835 | +97 |
| Hartley Parish | 5,409 | 5,359 | +50 | |
| Longfield and Southfleet ward | 2,732 (+211) | 6,827 | 6,246 | +581 |
| Longfield & New Barn parish | 5,361 | 4,919 | +442 |
The ONS also publish data of population of each postcode. Some postcodes cross parish boundaries, so on those I have had to guess the numbers for each parish based on an average of the number of houses.
Age
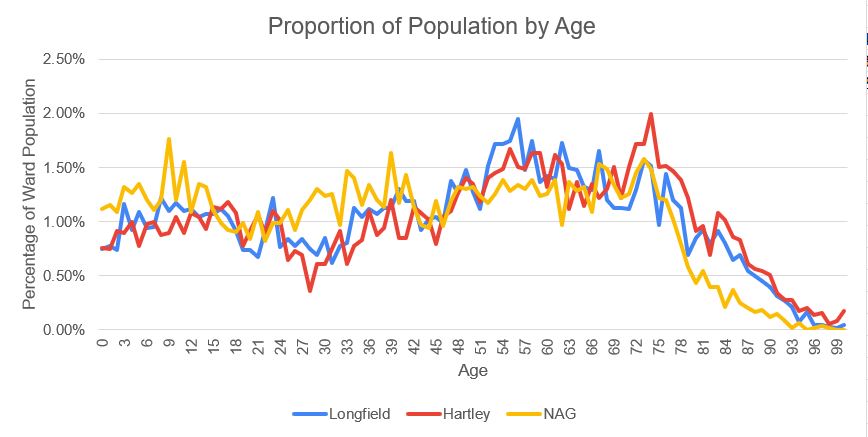
While Hartley and Longfield have a fairly similar age profile, New Ash Green is somewhat of an outlier, having a greater proportion of children and younger adults and fewer elderly.
Hartley and Hodsoll Street has the oldest age profile of anywhere in North Kent by some margin. 32.2% of people in Hartley are 65 and over, the only ward in north Kent to exceed 30%. This is a considerable rise since the last census when 27% of the population fell into this age group. New Ash Green has considerably greyed too with the proportion of their people over the age of 65 rising from 12.9% in 2011 to 22.1% in 2021, as the cohort of young adults who moved there in the late 1960s and early 1970s have reached retirement age. See table below for more details.
Overall 46% of people in the 3 villages are under the age of 45, but the Output Areas show a considerable range from Bramblefield (5%) to Caling Croft (69%). No part of New Barn is above average. The Chase estate in Longfield, which is one of the area's newest, has the highest number of children and young adults under the age of 20 at 36% of those who live there, perhaps a bit surprising given the high prices for homes there coupled with the unsuitabilty of much of the affordable housing for families.
The median age in Hartley is 52 years, for Longfield it is 50. New Ash Green is lower at 42. The most common ages at Hartley were 74 (118 people), and 72-73 (102 each).
Percentage of Population by Age Band compared with last census
Figures in red show fall since previous census
Longfield | NAG/Ash | Hartley/Hodsoll St | ||||||||||||
Age | 2011 | 2021 | 2011 | 2021 | 2011 | 2021 | ||||||||
| 0 to 4 | 3.6% | 4.3% | 6.2% | 6.0% | 3.5% | 4.3% | ||||||||
| 5 to 9 | 4.6% | 5.3% | 5.7% | 6.7% | 5.4% | 4.6% | ||||||||
| 10 to 14 | 5.5% | 5.5% | 6.4% | 6.5% | 6.0% | 4.9% | ||||||||
| 15 to 19 | 6.0% | 4.9% | 6.6% | 4.9% | 5.7% | 5.3% | ||||||||
| 20 to 24 | 4.6% | 4.3% | 6.1% | 4.7% | 4.3% | 5.0% | ||||||||
| 25 to 29 | 3.8% | 3.8% | 6.7% | 5.6% | 3.4% | 3.0% | ||||||||
| 30 to 34 | 3.3% | 4.1% | 5.5% | 6.4% | 3.2% | 3.6% | ||||||||
| 35 to 39 | 4.4% | 5.4% | 5.8% | 6.4% | 4.2% | 4.9% | ||||||||
| 40 to 44 | 7.0% | 5.6% | 6.8% | 5.6% | 6.5% | 4.8% | ||||||||
| 45 to 49 | 8.1% | 6.2% | 7.1% | 6.0% | 8.2% | 5.6% | ||||||||
| 50 to 54 | 8.0% | 7.3% | 7.3% | 6.4% | 7.2% | 6.8% | ||||||||
| 55 to 59 | 7.3% | 8.2% | 8.0% | 6.5% | 6.8% | 7.9% | ||||||||
| 60 to 64 | 8.1% | 7.5% | 9.0% | 6.4% | 8.6% | 6.9% | ||||||||
| 65 to 69 | 7.0% | 6.6% | 5.8% | 6.7% | 8.1% | 6.4% | ||||||||
| 70 to 74 | 6.2% | 6.6% | 2.5% | 7.0% | 6.1% | 8.1% | ||||||||
| 75 to 79 | 5.3% | 5.4% | 1.8% | 4.8% | 5.3% | 7.1% | ||||||||
| 80 to 84 | 3.7% | 4.2% | 1.6% | 1.9% | 3.9% | 4.7% | ||||||||
| over 85 | 3.4% | 4.3% | 1.1% | 1.6% | 3.6% | 5.9% | ||||||||
Sex
All three wards have around 52% population who is female. Only 8 of the 54 small Output Areas have a male majority, the largest being the 54% in the Fairlight Cross area of New Barn. Given the greater longevity of females, it is unsurprising that the areas with the greatest proportion of the elderly also have the greatest number of females, the highest being Bramblefield (66%), Turners Oak (58%) and the part of Main Road containing the Hazlewood Home (57%).
Marital Status
Overall 55% of adults in our area are married or civil partners with an additional 2% married but separated. 27% are never married, 9% divorced and 8% widowed. 99.7% of marriages are opposite sex, 0.3% same sex.
When it comes to smaller Output Areas, a lot of the differences can be put down the differing age profile. Those with a greater proportion of older people also have higher numbers of divorced and widowed. Note they have no separate category for co-habitants, which might explain the high levels of never married in some areas.
Disability
Overall 7% of people locally said they had a disability which seriously limited day to day activities with another 25% saying they had a disability which limited activities a little. The definition of disability included both mental and physical limitations.
As might be expected the smaller Output Areas with the greatest number of elderly people also tend to have the highest number of those with disabilities.
Identity
Ethnicity
94% of people in our area said they were White, 3% Asian, 1.0% Black, and 2% Mixed. The smaller Output Areas with the hightest for each ethnic group were: White (Cherry Trees etc, Bramblefield 99%), Asian (The Chase Longfield 11%), Black (Farm Holt etc 4%), Mixed (Coltstead etc 4%).
Identity
55% of people identify as British only, 24% as English only, and 15% as English and British, leaving 5% giving some other identity (e.g. Welsh, Irish or some identity, some in combination with UK identity).
Of the smaller Output Areas, those most likely to say "British" or "English and British" were Downs Valley etc (80%), Ash Village (79%) and The Chase Estate in Longfield (77%). Those who think of themselves as English only were highest in Bramblefield (41%), Springcroft etc (39%) and Deerhurst Close etc (33%).
Religion
While nationally the number of people who are Christian has fallen below 50%, this is not the case in our area, where 57.7% said they Christian. For the remainder the figures were No Religion (38.7%), Sikh (1.3%), Hindu (0.8%), All Others (1.4%),
The highest scoring Output Areas for Christianity were Bramblefield (80%), Foxwood Way etc (79%) and Ash Village (69%). Atheists scored highest in Northfield etc (56%), Caxton Close (55%) and Caling Croft (49%). In Gorse Way and two areas of New Barn, 6% of respondents were Sikh.
This question was not mandatory, so the percentages above exclude the 5.8% of people who did not answer the question.
Language
Overall 98.2% of people in our area have English as their main language. Just 38 people (0.2%) said they had no proficiency in English. Many Output Areas reported 100% returns for English as first language. No area had more than 6% saying English was not their first language, and as we have seen most of them said they were proficient in English.
Housing and Migration
Housing
Owner occupation in our area has fallen slightly from 83.5% in 2011 to 82.3% in 2021. Although the aging population has meant that the numbers of people owning outright without a mortgage has risen. The remainder is made up of Social Rent (9%) and Private Rent (11%).
While owner occupation has not changed much since 1981, as a result of government policy, social rent and private rent have changed places. In 1981 owner occupation was 80%, Social Rent 15% and Private Rent 4%. Note back then the local government wards were different, so these figures include Fawkham also.
For the smaller Output Areas owner occupation ranges from 25% in the Turners Oak area to 98% in the Gorse Way area. Turners Oak also has the highest number of Social rented at 56% of all properties in the area, closely followed by Caxton Close (55%). Some areas have very significant proportion of private rented, notably Ayelands (30%), Essex Road and Seven Acres (22%).
Migration
Respondents were asked to give their former address if they had moved to Hartley/Longfield/New Ash Green in the previous year. It shows a very stable population as 93% of people were still at the same address, suggesting that people only move on average every 15 years.
The table below shows the origins of migrants to our area. By far the most popular area to move here from is Dartford and South East London, which I think has always been the case. One striking figure bears out a local saying that people move within New Ash Green rather than out of it. Nearly a quarter of the people at a new address in New Ash Green had moved there from elsewhere in the village. That is 4 times the number of people who moved within Hartley.
All three wards have similar levels of people born in the UK at around 93.5%. Less than 1% in all 3 wards have lived in the UK for less than 5 years. The highest numbers of those born abroad come from Europe, ranging from 2.3% (Hartley) to 2.9% (NAG), followed by Asia ranging from 1.2% (NAG) to 2.2% (Longfield).
Table: Where people moved here from in the last year
Origin Town | Destination Village | Total | ||
Longfield/S'Fleet | Hartley/Hodsoll St | NAG/Ash | ||
| Dartford (not L'Field/S'Fleet) | 95 | 52 | 37 | 184 |
| Bexley/Bromley/Orpington/Erith | 88 | 45 | 47 | 180 |
| Sevenoaks (not Hartley/NAG) | 38 | 58 | 59 | 155 |
| Gravesham | 90 | 39 | 25 | 154 |
| New Ash Green | 13 | 7 | 112 | 132 |
| Longfield/Southfleet | 23 | 24 | 24 | 71 |
| Hartley | 13 | 28 | 16 | 57 |
| Greenwich/Lewisham | 18 | 13 | 19 | 50 |
| Medway Towns | 18 | 14 | 14 | 46 |
| Tonbridge & Malling | 12 | 4 | 10 | 26 |
| All other locations in UK | 90 | 75 | 79 | 244 |
| All locations abroad | 24 | 17 | 24 | 65 |
Total | 6,789 | 5,890 | 6,000 | 18,679 |
Percent moved in last year | 7.7% | 6.4% | 7.8% | 7.3% |
Work
Work
The ONS splits type of work in different ways. They have 104 detailed categories and 21 broader categories (see ONS page). For the Output areas, the data is further aggregated into 8 categories. The largest category of employment is public sector (health, education, military and administration) where 27% of people work. This is followed by the 22% who work in Finance, Property and other professions, and then 17% employed in retail, hotel and similar services sector. Very few people work in once dominant agriculture (2% which includes energy and water) and industry (6%). Across the small output areas there is not a huge difference in the numbers employed in the public sector, but the more middle class areas of Hartley and New Barn have noticeably higher numbers in the financial services category.
45% of people over the 3 villages are in employment. Those areas with the higher numbers of working age people tend to have the most in employment, led by Millfield area (58%), Penenden (54%), and Punchcroft (53%). At the other end the Bramblefield Estate, which caters for the over 55s, has 14% of residents in employment.
On the census form people were also asked to give the address of their place of work. The data was aggregated to Middle Layer Super Output (MSOA) Origin and Destination data. In our area MSOAs are the same as the council wards (Longfield & Southfleet, Hartley & Hodsoll Street, New Ash Green & Ash)
As the census was taken in a period of furloughs and work from home mandates, the value of this data is diminished. It probably considerably understates the number of office workers in the City and Docklands.
The data does show that, while Hartley and New Ash Green may be in Sevenoaks district, the towns to the north (Dartford, Gravesend, Bexley) are much more important for employment. The data also infers that Darent Valley Hospital and Bluewater are major local employers.
Table: Where people work
Place of Work | Longfield/S'Fleet | Hartley/Hodsoll St | NAG/Ash | Total |
| Work from Home | 1,715 | 1,431 | 1,414 | 4,560 |
| Dartford/Darent Valley H/Bluewater | 247 | 146 | 165 | 558 |
| Bexley/Bromley/Orpington/Erith | 175 | 137 | 208 | 520 |
| Gravesend/Northfleet | 162 | 60 | 76 | 298 |
| Central London | 100 | 80 | 82 | 262 |
| Longfield/Southfleet | 115 | 59 | 76 | 250 |
| Sevenoaks/Swanley | 36 | 74 | 98 | 208 |
| Hartley | 37 | 72 | 88 | 197 |
| Tonbridge & Malling | 32 | 65 | 94 | 191 |
| New Ash Green | 12 | 26 | 133 | 171 |
| Greenwich/Lewisham | 61 | 38 | 57 | 156 |
| Medway Towns | 62 | 31 | 46 | 139 |
| Maidstone | 29 | 31 | 56 | 116 |
| Docklands | 18 | 13 | 23 | 54 |
| All other parts of D'Ford,G'ham/S'Oaks | 170 | 125 | 140 | 435 |
| All other locations | 152 | 104 | 175 | 431 |
Total in Work | 3,123 | 2,492 | 2,931 | 8,546 |
Standard of Living
Car Ownership
37% of households have 1 vehicles, 36% have 2 cars and 18% have 3 or more. One in ten households have no car, with the highest concentrations in the Output Areas of Turners Oak (44%) and Bramblefield (29%), Main Road part including Hazlewood Home (24%) and Wellfield (18%). The roads around Longfield station also have significant numbers of no-car households. As might be expected the more rural areas of South Hartley (36%), Hodsoll Street (34%) and Ash Village (27%) are most likely to have a fleet of 3 or more cars on the drive.
While the number of no car households is little changed from the 12% in 1981, it is clear that more households are owing multiple cars. In 1981 people in our area owned a total of 6,464 cars and vans but in the 2021 census it was 13,132. However there are some recording differences. The 1981 figures also include Fawkham, the 2021 figures exclude Fawkham but include Southfleet, and in 1981 only were vans excluded if used exclusively for commercial purposes. Even so total car ownership must have nearly doubled in the last 40 years.
Household Deprivation
These figures are important as government departments use these when deciding where to allocate funds when one of their aims is to reduce inequality.
The census has 4 dimensions of deprivation, not all of them econcomic:
- Education - no-one in the household has a minimum 5 O Levels, or 16-18 year olds not at school
- Employment - a member of the household is unemployed or long term sick
- Health - a member of the household is disabled or has bad or very bad health
- Housing - house is deemed to be overcrowded (see below)
Over half (52%) of households in our area have no measures of deprivation, the Output Areas range from 23% (Turners Oak) to 69% (Fairlight Cross). Two areas (Brambledown and, perhaps surprisingly, Ash Village) have 10% of households which have 3 or 4 measures of deprivation.
There is more details on the occupancy rating. This is the assumed number of bedrooms required for the persons in the household. It is not very generous, it assumes two teenage children of the same sex would share a bedroom for example. So two parents and two teenage children of the same age are deemed to need 2 bedrooms, if the children were of different sex then the requirement is 3 bedrooms.
On this measure most houses locally (81%) are underoccupied and only 2% overcrowded (rising to 10% for the Brambledown Output Area).
Passports
Overall 91% of people in our area have passports, the vast majority being British passports. The roads where significant numbers did not have a passport tend to be the areas where the residents are older or poorer. The majority of non-British passports being Irish or other EU. The Output Areas where people are least likely to have a passport are Bramblefield (29%), Caxton Close etc (24%) and Main Road (part including Hazelwood Home 20%),
Social Grade
The Office for National Statistics tends to use a 0-9 category these days, but they still provide statistics on the traditional ABC classifications beloved by advertisers, and which ensures a comparison can be made with older data. Across the 3 villages the breakdown is:
- AB (Professional/Managerial) 29%
- C1 (Clerical) 38%
- C2 (Skilled manual) 21%
- DE (Semi- and unskilled manual, unemployed) 12%
As might be expected the more middle class Output Areas also have the highest number of ABC1 social class people. The highest being Downs Valley etc (89%), Shearwater etc (85%), and Round Ash Way etc (85%). The Output Areas with the highest number of the C2DE social classes are Caxton Close (59%), Brambledown (55%) and Bazes Shaw (54%).
Copyright Acknowledgement
Contains public sector information licensed under the Open Government Licence v3.0.